To totally unlock this section you need to Log-in
Login
Let's begin saying that monitoring any system is strongly recommended in an IT infrastructure, and for data analysis and good performance even in a SQL Server is strongly recommended. Memory affects SQL Server performance more than any other piece of hardware. Without enough memory, SQL Server is forced to read and write data to disk to complete a query. Memory access is 1,000 to 100,000 times faster than disk access.
You need to monitor SQL Server memory usage regularly to ensure enough memory is available for mitigating drastic performance problems and to ensure SQL Server is running as fast as possible.
The good news is that SQL Server provides built-in tools, which you can use to track down the root cause of SQL Server memory bottlenecks, identify how much memory is available, and how SQL Server is currently using the memory.
Dynamic management views
Dynamic management views, first introduced with SQL Server 2005, provide information about server and database state. These views are useful for monitoring overall SQL Server health, identifying the root cause of SQL Server performance bottlenecks, and tuning SQL Server instance or database performance.
The following is a list of dynamic management views available in SQL Server 2008 R2, SQL Server 2012 and SQL Server 2014. You can use these views to obtain SQL Server memory usage information; for example, how much memory is available to a SQL Server instance or how well a SQL Server instance is using the available memory.
- sys.dm_os_sys_info: Returns computer resources usage information.
- sys.dm_os_memory_cache_counters: Returns run-time information about the cache entries allocated, their use and the source of memory for the cache entries.
- sys.dm_os_memory_nodes: Returns information about the memory nodes.
- sys.dm_os_memory_cache_entries: Returns original and current cost of any cache entry.
- sys.dm_os_memory_cache_hash_tables: Returns a row for each active cache in the instance of SQL Server.
- sys.dm_os_memory_cache_clock_hands: Returns the status of each hand for a specific cache clock.
- sys.dm_os_memory_clerks: Returns detailed information about all memory clerks, which SQL Server is currently consuming.
- sys.dm_os_memory_objects: Returns information about the memory objects currently allocated by the instance of SQL Server.
- sys.dm_os_performance_counters: Returns SQL Server-specific performance counter information.
- sys.dm_os_ring_buffers: Returns detailed information about system health. The information returned is useful to troubleshoot memory pressure. This view is not currently supported by SQL Server 2014.
You can use the sys.dm_os_memory_clerks dynamic management view (DMV) to get detailed information about memory allocation by the server components in SQL Server 2005 and 2008. Some of the DMVs provide similar data as the DBCC MEMORYSTATUS command, but their output is much more programmer friendly. For example the following query returns the amount of memory SQL Server has allocated through the AWE mechanism (Address Windowing Extensions (AWE) allowing use of physical memory over 4 gigabytes (GB) on 32-bit versions of Microsoft Windows operating systems).
SELECT SUM(awe_allocated_kb)
FROM sys.dm_os_memory_clerks
You can also check the amount of memory that is consumed from outside of the buffer pool through the multipage allocator.
SELECT SUM(multi_pages_kb)
FROM sys.dm_os_memory_clerks
If you are seeing significant amounts of memory (more than 100-200 MB) allocated through the multipage allocator, check the server configuration and try to identify the components that consume the most memory by using the following query:
SELECT type, SUM(multi_pages_kb)
FROM sys.dm_os_memory_clerks
WHERE multi_pages_kb <> 0
GROUP BY type
ORDER BY SUM(multi_pages_kb) DESC
In SQL Server 2008, you can query the sys.dm_os_process_memory DMV to retrieve similar data. Look for the columns physical_memory_in_use, large_page_allocations_kb, locked_pages_allocations_kb and memory_utilization_percentage. The process_physical_memory_low = 1 value indicates that the process responds to physical memory low notification from the OS.
Check the main consumers of the buffer pool pages:
SELECT type,
       SUM(single_pages_kb) as [Single Pages],
       SUM(multi_pages_kb) as [Multi Pages]
FROM sys.dm_os_memory_clerks
GROUP BY type
In SQL Server 2005 and 2008, internal clock hand controls the relative size of caches. It launches when the cache is about to reach its maximum. The external clock hand moves as the SQL Server gets into memory pressure. Information about clock hands can be obtained through the sys.dm_os_memory_cache_clock_hands DMV. Each cache has a separate entry for the internal and the external clock hand.
If the rounds_count and removed_all_rounds_count values are increasing then your server is under memory pressure.
SELECT  *
FROM sys.dm_os_memory_cache_clock_hands
WHERE rounds_count > 0
You can get additional information about the caches by joining with the sys.dm_os_cache_counters (Please note that the amount of pages is NULL for USERSTORE entries):
SELECT
    distinct mcc.cache_address,
    mcc.name,
    mcc.type,
    mcc.single_pages_kb,
    mcc.multi_pages_kb,
    mcc.single_pages_in_use_kb,
    mcc.multi_pages_in_use_kb,
    mcc.entries_count,
    mcc.entries_in_use_count,
    mcch.removed_all_rounds_count,
    mcch.removed_last_round_count
FROM sys.dm_os_memory_cache_counters mcc
    JOIN sys.dm_os_memory_cache_clock_hands mcch
 ON (mcc.cache_address = mcch.cache_address)
Virtual Address Space consumption can be tracked by using the sys.dm_os_virtual_address_dump DMV. If the largest available region is less than 4 MB then your system is most likely under VAS pressure. SQL Server 2005 and 2008 actively monitor and respond to VAS pressure.
DBCC MEMORYSTATUS command
MEMORYSTATUS is an undocumented DBCC command that provides a snapshot of SQL Server's current memory status. This memory usage information helps you quickly identify the root cause of the memory pressure on SQL Server and analyze how well SQL Server is using its allocated memory. Some of the information included in DBCC MEMORYSTATUS output is still not available through dynamic management views. That is why Microsoft Customer Support Services teams and experienced database administrators still rely on this undocumented DBCC command to quickly troubleshoot SQL Server memory consumption issues.
The DBCC MEMORYSTATUS command describes the distribution of 8k buffers among various components of SQL Server. It provides measurements that show how memory is currently allocated in SQL Server, information that is particularly useful if you're troubleshooting issues related to SQL Server memory consumption. The command's output (Figure 1) shows:
- Distribution of committed memory
- Size and makeup of the buffer pool
- Makeup of the procedure cache
- Distribution of Dynamic Memory Usage
- Distribution of various global memory usage
- Query memory grant information
- Concurrent query optimization status
- Memory management information, such as VM Reserved, VM Committed, AWE Allocated, Reserved Memory, Reserved Memory In Use
- How the SQL Server buffer cache is divided up, including buffer activity
- Information about Memory Manager, Clerks, Buffer Manager and a number of other SQL Server processes that consume SQL Server memory
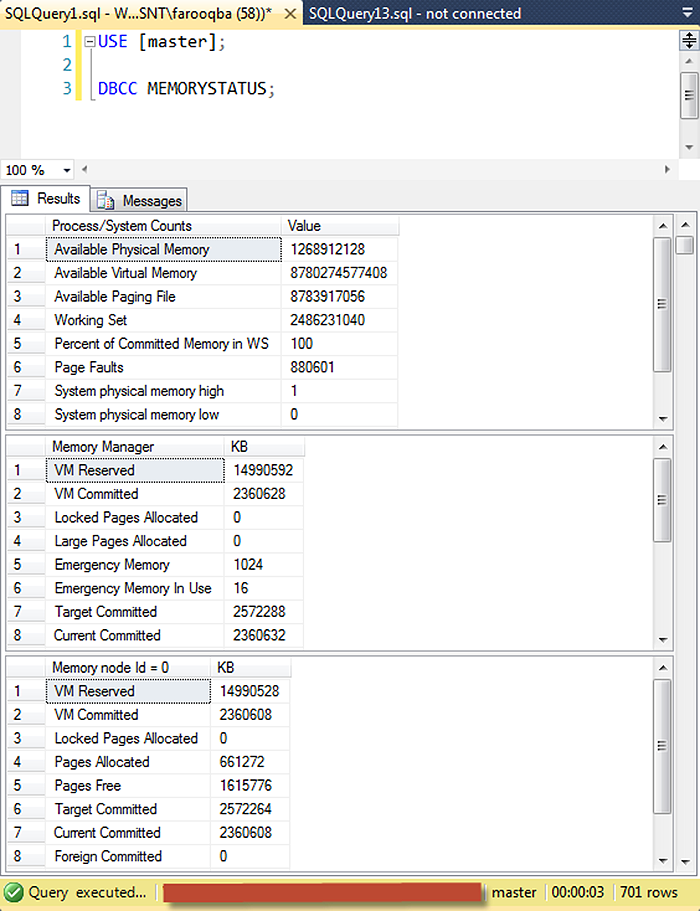
Run the DBCC MEMORYSTATUS command and scroll down to the Buffer Pool section (or Buffer Counts in SQL Server 2005), look for the Target value. It shows the number of 8-KB pages which can be committed without causing paging. A drop in the number of target pages might indicate response to an external physical memory pressure.
If the Committed amount is above Target, continue investigating the largest memory consumers inside SQL Server. When the server is not loaded, Target normally exceeds Committed and the value of the Process: Private Bytes performance counter.
If the Target value is low, but the server Process: Private Bytes is high, you might be facing internal SQL memory problems with components that use memory from outside of the buffer pool. Such components include linked servers, COM objects, extended stored procedures, SQL CLR, etc. If the Target value is low but its value is close to the total memory used by SQL Server, than you should check whether your SQL Server received a sufficient amount of memory from the system. Also you can check the server memory configuration parameters.
You can compare the Target count against the max server memory values if it is set. Latter option limits the maximum memory consumption of the buffer pool. Therefore the Target value cannot exceed this value. Also the low Target count can indicate problems: in case it is less than the min server memory setting, you should suspect external virtual memory pressure.
Windows Performance Monitor
Windows Performance Monitor is a Microsoft Management Console (MMC) snap-in that provides several useful counters that you can use to track SQL Server memory usage.
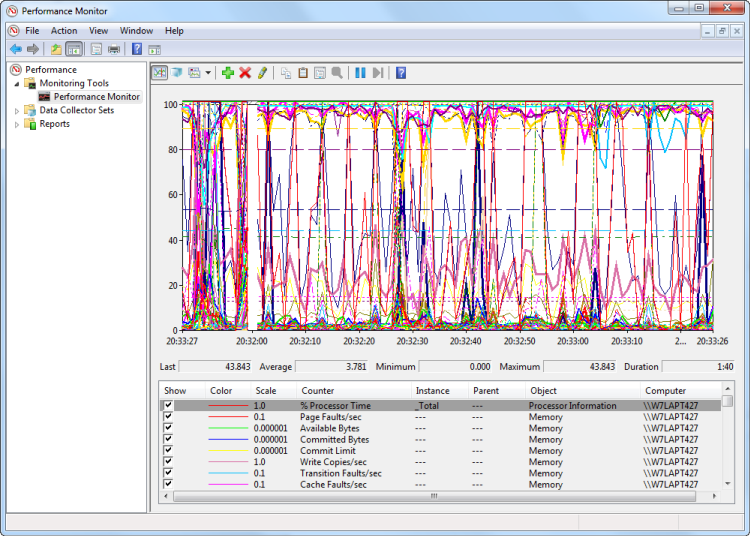
Using Windows Performance Monitor, watch these three general categories of memory counter:
- Potential low-memory conditions in system memory
- SQL Server memory usage, so you can determine whether or not SQL Server is causing the problem
- Potential low memory conditions related to the In-Memory OLTP engine
The following table shows the most common memory-related performance counters you should monitor if you're experiencing memory pressure on SQL Server.
| Object | Counter | Description |
| Memory | Available Bytes | Amount of memory available for processes; should be consistently higher than 5,000 KB. |
| Memory | Pages/sec | Should never climb consistently above 0. |
| Process | Page Faults/sec | A high value indicates excessive paging, which can result in both memory and the hard disk becoming performance bottlenecks. You must determine if the problem is being caused by SQL Server or by another process running on the system. |
| Process | Working Set | Monitor this value for each instance of SQL Server running on the system to determine the amount of system memory being used by SQL Server. This value should be greater than 5,000 KB at all times. |
| SQLServer: Buffer Manager | Buffer Cache Hit Ratio | For most applications, this value should be 90 or higher, indicating that most data requirements are being serviced from the cache. A lower value can indicate a memory bottleneck or a poorly designed application. |
| SQLServer: Buffer Manager | Total Pages | A low value here can indicate a need to install additional memory. Typically, a low number here is accompanied by a low Buffer Cache Hit Ratio. |
| SQLServer: Memory Manager | Total Server Memory (KB) | If this value is relatively high in comparison to total system memory, it's a good indicator that you should install more memory. |
SQL Server metrics
Memory metrics indicate server health.
The operating system provides a number of performance counters that are associated with memory. The most important are: Pages/sec, Page Faults/sec, Pages Input/sec, Pages Output/sec, Page Reads/sec, Page Writes/sec, Available Memory, Non-pageable memory pool bytes, Pageable memory pool bytes, and Committed Bytes.
Adding memory can solve some of the performance issues caused by insufficient memory. If some parameters are not properly configured and performance issues properly diagnosed, additional memory will not improve SQL Server performance and you’ll be back to square one
Pages/sec
Pages/sec is one of the most important memory metrics. It’s recommended to monitor it whatever performance goals are.
The pages/sec counter “Shows the rate at which pages are read from or written to disk to resolve hard page faults. This counter is a primary indicator of the kinds of faults that cause system-wide delays. It is the sum of Memory\ Pages Input/sec and Memory\ Pages Output/sec. It is counted in numbers of pages, so it can be compared to other counts of pages, such as Memory\ Page Faults/sec, without conversion. It includes pages retrieved to satisfy faults in the file system cache (usually requested by applications) and noncached mapped memory files.”
Note that this is not the same as Page Faults/sec.
The average Pages/sec value should be below 50. It’s not possible to reduce the value to zero, as moving pages from memory and to memory always occurs while the operating system is running. The more memory the server has, fewer pages have to be written and read due to page faults.
A high value of Pages/sec indicates intensive memory activity – many pages are written from disk to RAM and read from RAM to disk. High Pages/sec values can indicate insufficient RAM memory, overhead and SQL Server performance degradation, but it doesn’t necessarily have to be so. A high Pages/sec value can also be caused by sequential reading of a file mapped in memory. To determine whether this is the case, check the Memory Available Bytes and Paging File % Usage values.
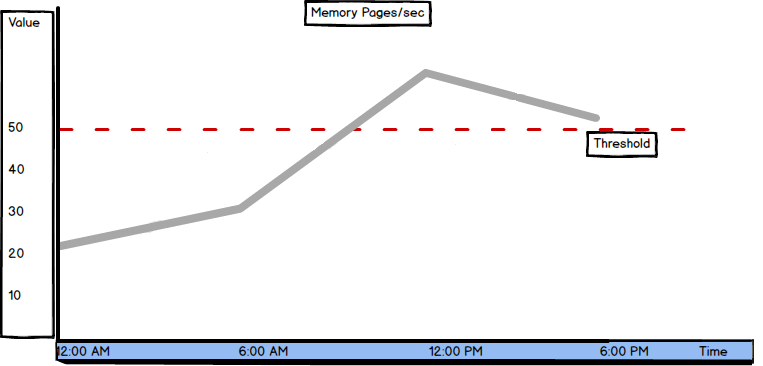
Occasional peaks are normal and appear when creating SQL Server database and transaction log backups, restoring databases, importing and exporting data, and performing other complex tasks.
It’s recommended to have a dedicated server for SQL Server only, as other applications can use memory needed by SQL Server and affect SQL Server performance. A counter that indicates that this is the case is Buffer Hit Cache Ratio. If its value is 99% or higher for more than 24 hours and during this same period the Pages/sec value is higher than 50, other applications use memory needed by SQL Server.
If there are no other applications and Pages/sec is still higher than 50, SQL Server is not taking as much memory as it needs, which means that the memory settings are not configured correctly.
In SQL Server Management Studio Object Explorer, right click the SQL Server instance:
- Select Properties
- Open Memory
- Set the Maximum server memory (in MB) to approximately 80% of available physical memory, in order to leave enough memory for the operating system
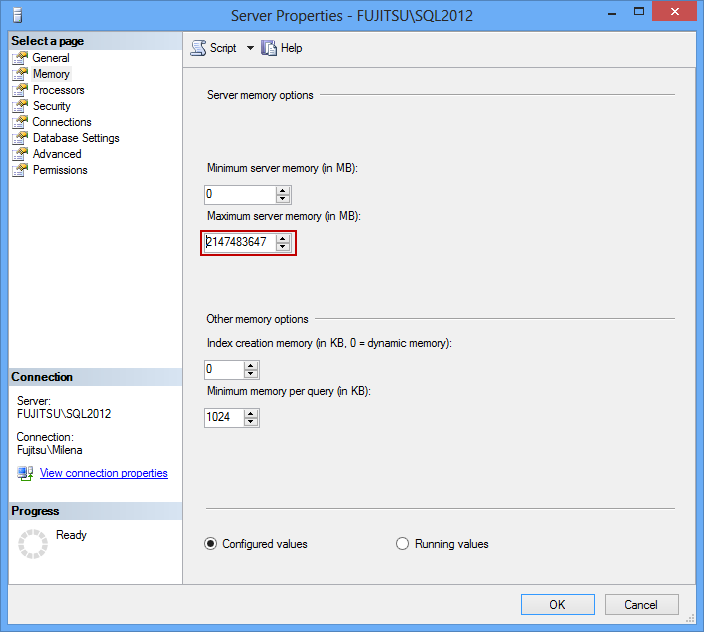
If SQL Server has already been allocated maximum available memory, the solution is adding additional RAM.
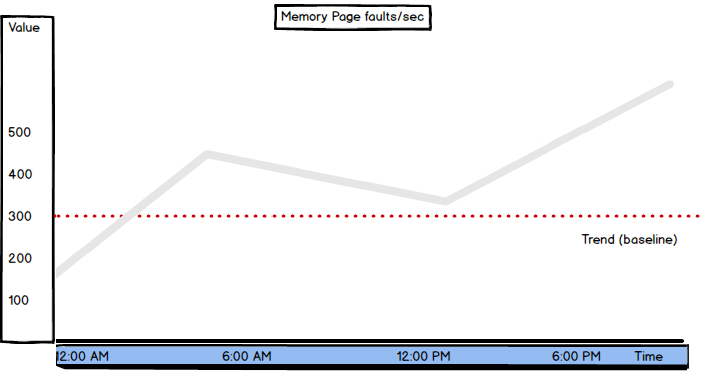
Page Faults/sec
Page faults are one of the most common problems with memory.
“A page fault occurs when a program requests an address on a page that is not in the current set of memory resident pages”.
When a page fault is encountered, the program execution stops and is set to the Wait state. The operating system searches for the requested address on the disk. When the page is found, the operating system copies it from the disk into a free RAM page. The operating system allows the program to continue with the execution afterwards.
There are two types of page faults – hard and soft page faults. Hard page faults occur when the requested page is not in the physical memory. Soft page faults occur when the requested page is in the memory, but cannot be accessed by the program as it is not on the right address, or is being accessed by another program.
Monitoring page faults is important as excessive hard page faults affect application performance. Soft page faults cause no performance issues. The Page faults/sec counter shows both hard and soft page faults, so it can be difficult to determine whether the page faults value indicates performance problems in SQL Server, and should be addressed, or presents a normal state.
There is no specific Page faults/sec value that indicates performance problems. Monitoring Page faults/sec should provide enough information to create a baseline that will be used to determine normal server performance. The normal values are 10 to 15, but even 1,000 page faults per second can be normal in specific environments.
The value depends on the type and amount of memory, and the speed of disk access. A sustained or increasing value for Page faults/sec can indicate insufficient memory. If this is the case, check the Page reads/sec value, as it also indicates hard page faults. If the latter is also high, it indicates insufficient memory on the machine.
Pages/sec and Page faults/sec are two of several most important memory performance metrics. Their high values don’t necessarily indicate memory problems. Sometimes it’s normal and checking other memory metrics is necessary to determine whether there’s a serious issue with performance. However, these metrics should not be skipped in any SQL Server performance monitoring scenarios.
Available bytes
“The Available Bytes counter indicates how many bytes of memory are currently available for use by processes.”
SQL Server doesn’t use a fixed amount of memory by default. The memory used is determined dynamically, based on SQL Server current needs and available system memory. If SQL Server needs more memory than currently allocated and there’s memory available in the system, the operating system will allow additional memory allocation for SQL Server. If on the other hand, SQL Server allocated more memory that it needs at the moment, the excessive memory will be released to the operating system and the operating system can allocate it to other applications.
If the memory Available bytes value is constantly lower than 100 MB, it indicates that there is insufficient memory on the server, or that there is an application that is not releasing memory. In case of insufficient memory, the Pages/sec and Page faults/sec values will also be high, as there is not enough memory to store all needed pages, and intensive writing into and reading from memory occurs.
When there’s enough memory on the server, the available memory is high, page faults are rare, and Pages/sec and Page faults/sec are low.
For good SQL Server performance, available memory should not be less than 200 MB. The threshold value depends on the system configuration and usage. It’s recommended to have a dedicated machine for SQL Server where no other applications run, so the physical memory is used only by the operating system and SQL Server.
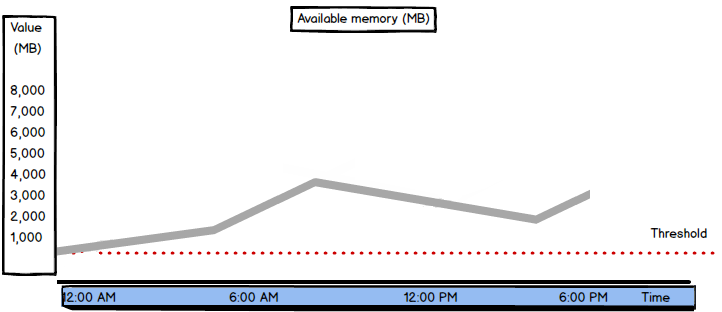
If there are peaks in available memory, check the disk activity. If disk activity increases when available memory is low, check whether it’s due to complex SQL Server tasks – backups, restores, etc. If not, this indicates memory pressure on the system.
If available memory is constantly low and server load cannot be reduced, it’s necessary to add more RAM.
Total Server Memory (KB)
“Specifies the amount of memory the server has committed using the memory manager.”
In other words, this is the amount of memory currently assigned to SQL Server. The Total Server Memory value is a metric tracked by SQL Server performance counter. It can be obtained by querying the sys.dm_os_performance_counters system view.
SELECT object_name ,counter_name, cntr_value
FROM sys.dm_os_performance_counters
WHERE counter_name = 'Total Server Memory (KB)'
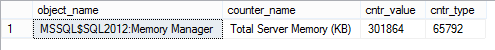
If the Total Server Memory (KB) value is consistently high, it means that SQL Server is constantly using a lot of memory and that the server is under memory pressure.
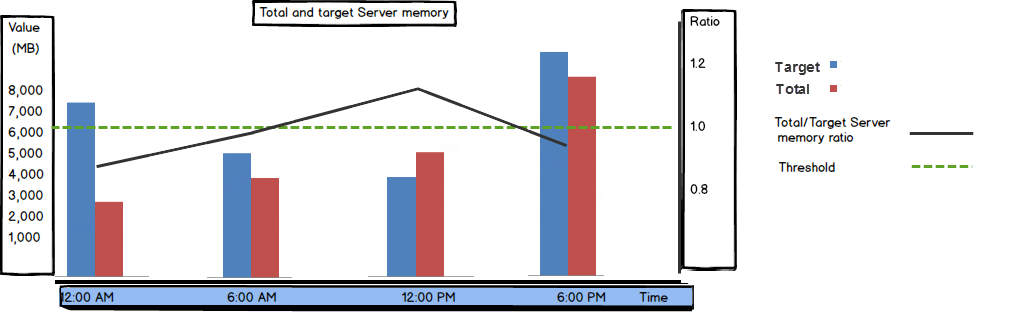
Target Server Memory (KB)
“Indicates the ideal amount of memory the server can consume.”
The Target Server Memory (KB) value shows how much memory SQL Server needs to for best performance.
Similar to Total Server Memory, the Target Server Memory (KB) value is tracked by SQL Server counters and can be obtained from the sys.dm_os_performance_counters system view.
SELECT object_name ,counter_name, cntr_value
FROM sys.dm_os_performance_counters
WHERE counter_name = 'Target Server Memory (KB)'
![]()
When the Total Server Memory and Target Server Memory values are close, there’s no memory pressure on the server.
In other words, the Total Server Memory / Target Server Memory ratio should be close to 1. If the Total Server Memory value is significantly lower than the Target Server Memory value during normal SQL Server operation, it can mean that there’s memory pressure on the server so SQL Server cannot get as much memory as needed, or that the Maximum server memory option is set too low.
As shown, the Available memory bytes metrics is one of the SQL Server performance parameters that can be used to indicate performance problems without setting a baseline first. If the available memory is constantly low, the performance is suffering.
The Total Server Memory (KB) and Target Server Memory (KB) values should be analyzed together, as their ratio helps determining the right course of action to fix performance issues.
Page reads/sec
“Page reads/sec indicates the number of physical database page reads that are issued per second. This statistic displays the total number of physical page reads across all databases. Because physical I/O is expensive, you may be able to minimize the cost, either by using a larger data cache, intelligent indexes, and more efficient queries, or by changing the database design.”
In other words, this shows how many times the pages were read from disk, in a second. Please note that this is not the number of pages read from disk (which is the Pages input/sec metric described below). This is a server-level metric, the number indicates page reads for all databases on the instance.
The recommended Page reads/sec value should be under 90. Higher values indicate insufficient memory and indexing issues.
The value can be obtained from the sys.dm_os_performance_counters system view:
SELECT object_name, counter_name, cntr_value
FROM sys.dm_os_performance_counters
WHERE [object_name] LIKE '%Buffer Manager%'
AND [counter_name] = 'Page reads/sec'
Page writes/sec
The Page writes/sec metric is similar to Page reads/sec and shows the number of times pages were written to disk on the server level.
“Indicates the number of physical database page writes that are issued per second.” The value can be obtained from the sys.dm_os_performance_counters system view:
SELECT object_name, counter_name, cntr_value
FROM sys.dm_os_performance_counters
WHERE [object_name] LIKE '%Buffer Manager%'
AND [counter_name] = 'Page writes/sec'
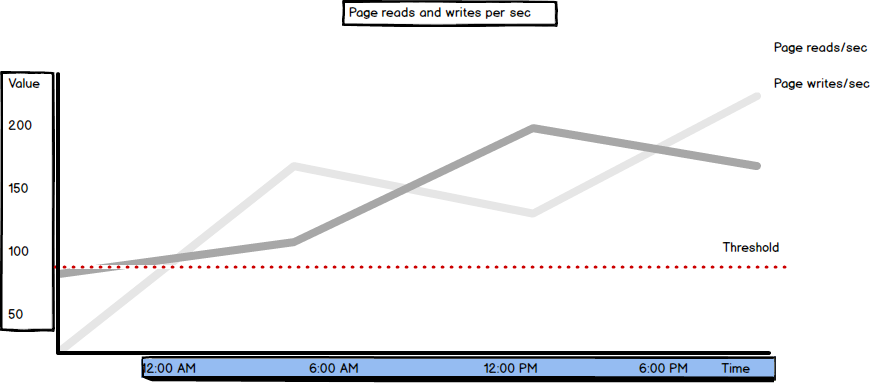
The same as Page reads/sec, the recommended value for Page writes/sec is below 90.
High paging and disk I/O activity indicate insufficient memory. If the excessive disk activity is not caused by paging (indicated by normal Page Faults/sec values, compared to the defined metric baseline), Page reads/sec and Page writes/sec will be high. In this situation, it’s recommended to check the Lazy writes/sec and Page Life.
Expectancy values as well, as the non-zero Lazy writes/sec and low Page Life Expectancy require attention.
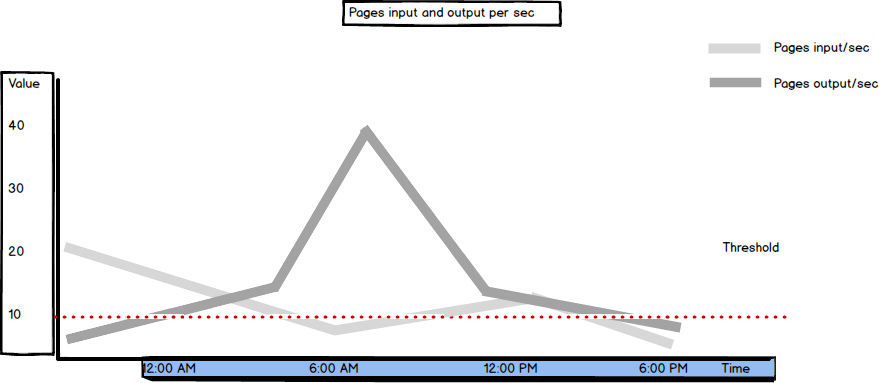
Pages Input/sec and Pages output/sec
Pages Input/sec and Pages Output/sec are memory counters.
Pages Input/sec is defined as “the number of pages brought in from disk every second. The difference between this value and Page Faults/sec represents soft page faults.”
Pages Output/sec is defined as “the number of pages written to disk every second to make room in the working set of the process for newly faulted pages. If the process modifies the pages, they must be written out. They cannot be discarded.”
In other words, these metrics show how many of the requested pages not available in memory had to be read from and written to disk in order to resolve hard page faults.
The Pages/sec metric is the sum of Pages Input/sec and Pages Output/sec. If the Pages/sec value is constantly higher than 50, to confirm that hard page faults are happening, additional investigation is needed. It’s recommended to monitor disk behavior and paging via memory and disk counters, such as Pages Input/sec, Pages Output/sec, Disk Reads/sec, and Avg. Disk Read Bytes/sec.
Another metric that is closely related to Pages Input/sec and Pages Output/sec is Page Faults/sec. It shows both hard and soft page faults. As soft page faults don’t affect SQL Server performance, it’s good to check the Page Reads/sec value first and compare it to Pages Input/sec. If the latter is greater, it indicates a high page fault rate that can be solved by increasing memory designated to SQL Server.
Both Pages Input/sec and Pages Output/sec values are recommended to be lower than 10.
SQL Server Buffer Manager Page reads/sec and Page writes/sec metrics, and Pages Input/sec and Page Output/sec memory counters help identify and solve performance issues, such as insufficient or inadequately configured memory. They show the number of times the pages were read/written from disk and the total number of pages read/written. The threshold is clearly defined so performance issues can be diagnosed without creating a baseline first.
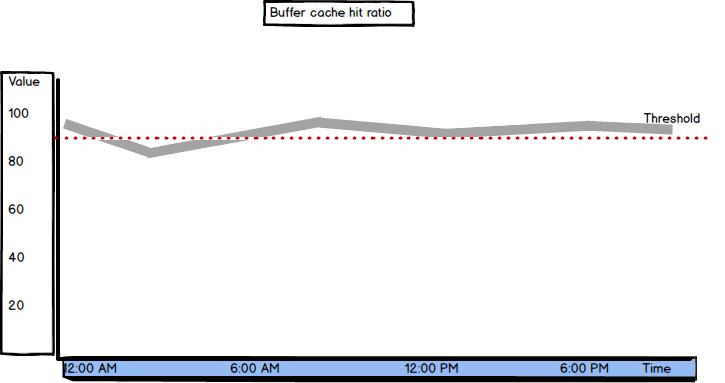
Buffer Cache Hit Ratio
Buffer Cache Hit Ratio shows how SQL Server utilizes buffer cache. “Percent of page requests satisfied by data pages from the buffer pool”.
It gives the ratio of the data pages found and read from the SQL Server buffer cache and all data page requests. The pages that are not found in the buffer cache are read from the disk, which is significantly slower and affects performance.
Ideally, SQL Server would read all pages from the buffer cache and there will be no need to read any from disk. In this case, the Buffer Cache Hit Ratio value would be 100. The recommended value for Buffer Cache Hit Ratio is over 90. When better performance is needed, the minimal acceptable value is 95. A lower value indicates a memory problem.
The fact that “after a long period of time, the ratio moves very little” explains the biggest disadvantage of this metric. In situations when performance is changing significantly, Buffer Cache Hit Ratio shows little variations, so you cannot be aware of the significance of the change.
That’s why other metrics, such as Page Life Expectancy are suggested. Their values can quickly drop or raise, which clearly indicates significant changes that require attention.
The same as with other Buffer Manager metrics, it’s value can be obtained from the sys.dm_os_performance_counters view:
SELECT object_name, counter_name, cntr_value
FROM sys.dm_os_performance_counters
WHERE [object_name] LIKE '%Buffer Manager%'
AND [counter_name] = 'Buffer cache hit ratio'
Due to inert behavior of Buffer Cache Hit Ratio, the values it shows can be misleading and it’s recommended to check values of other SQL Server Buffer Manager counters, such as Page Life Expectancy, Free list stalls/sec, Page reads/sec, etc.
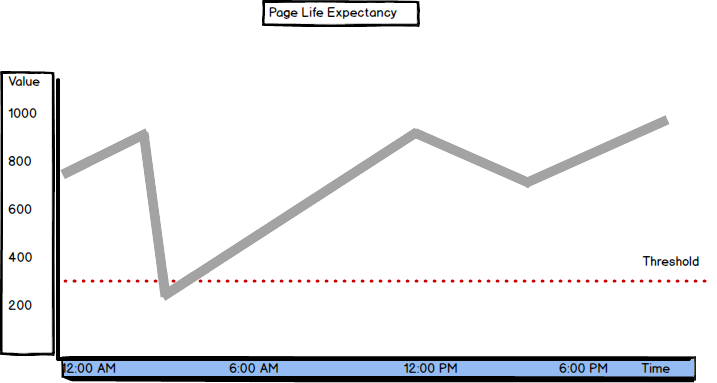
Page Life Expectancy
“Duration, in seconds, that a page resides in the buffer pool”.
SQL Server has more chances to find the pages in the buffer pool if they stay there longer. If the page is not in the buffer pool, it will be read from disk, which affects performance. If there’s insufficient memory, data pages are flushed from buffer cache more frequently, to free up the space for the new pages.
When there’s sufficient memory on the server, pages have a high life expectancy. The normal values are above 300 seconds (5 minutes) and the trend line should be stable. It’s recommended to monitor the values over time, as frequent quick drops indicate memory issues. Also, a value drop of more than 50% is a sign for deeper investigation.
As typical hardware configurations used currently provide more resources, the normal values are often high above 300. If there’s enough memory on the machine, the Page Life Expectancy value will be over 1,000. If the value is below 300, it’s a clear indication that something is wrong.
“For example, a server with 230GB RAM allocated to the SQL Server buffer pool and a Page Life Expectancy of 300 would equate roughly to 785MB/sec of I/O activity to maintain the page churn inside of the buffer pool. While it might be possible for the I/O subsystem to keep up with this demand, this represents a significant amount of page churn in the buffer pool”.
SELECT object_name, counter_name, cntr_value
FROM sys.dm_os_performance_counters
WHERE [object_name] LIKE '%Buffer Manager%'
AND [counter_name] = 'Page life expectancy'
The cause for Page Life Expectancy values below 300 can be poor index design, missing indexes, mismatched data types, insufficient memory, etc.
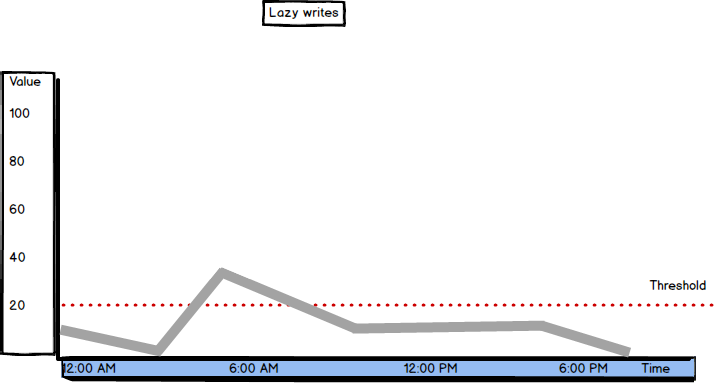
Lazy Writes
To understand the Lazy Writes metric better, we’ll explain the lazy writer process and checkpoints first.
Best performance is provided when SQL Server reads pages it needs from the buffer instead from disk. As the space available in the buffer is limited by physical memory, pages are constantly moved from the buffer to disk, to free up the space for new pages.
These pages are usually moved at a check point, which can be automatic (occurs automatically to meet the recovery interval request) , indirect (occurs automatically to meet the database target recovery time), manual (occurs when the CHECKPOINT command is executed), and internal (occurs along with some server-level operations, such as backup creation).
At a checkpoint, all dirty pages containing both committed and uncommitted transactions are flushed to disk. Then, the page in the buffer cache is marked for overwriting.
For performance reasons, the Database Engine performs modifications to database pages in memory,in the buffer cache, and does not write these pages to disk after every change. Rather, the Database Engine periodically issues a checkpoint on each database. A checkpoint writes the current in-memory modified pages (known as dirty pages) and transaction log information from memory to disk and, also, records information about the transaction log.
The lazy writer is a process that periodically checks the available free space in the buffer cache between two checkpoints and ensures that there is always enough free memory. When the lazy writer determines free pages are needed in the buffer for better performance, it removes the old pages before the regular checkpoint occurs.
If a dirty data page (a page read and/or modified) in the buffer hasn’t been used for a while, the lazy writer flushes it to disk and then marks as free in the buffer cache.
If SQL Server needs more memory then currently used and the buffer cache size is below the value set as the Maximum server memory parameter for the SQL Server instance, the lazy writer will take more memory. On the other hand, the lazy writer will release free buffer memory to the operating system in case there’s insufficient memory for Windows operations
The Lazy writes metric is defined as "Number of times per second SQL Server relocates dirty pages from buffer pool (memory) to disk".
The threshold value for Lazy Writes is 20. If SQL Server is under memory pressure, the lazy writer will be busy trying to free enough internal memory pages and will be flushing the pages extensively. The intensive lazy writer activity can cause a system bottleneck, as it affects other resources by causing additional physical disk I/O activity and using more CPU resources.
If the Lazy Writes value is constantly higher than 20, to be sure that the server is under memory pressure, check Page Life Expectancy. If its value is low (below 300 seconds), this is a clear indication of memory pressure. Check the Free List Stalls/sec value as well. If above 2, consider adding memory to the server.
Ideally, Lazy Writes should be close to zero. That means that the buffer cache doesn’t have to free up dirty pages immediately, it can wait for the automatic check point.
It would be logical to obtain the Lazy Writes value by querying the sys.dm_os_performance_counters view, like for other Buffer Manager counters.
SELECT object_name, counter_name, cntr_value, cntr_type
FROM sys.dm_os_performance_counters
WHERE [object_name] LIKE '%Buffer Manager%'
AND [counter_name] = 'Lazy writes/sec'
But, the value returned is higher by several orders of magnitude from the recommended minimum:
![]()
The reason for this is that the value shown for the cntr_type 272696576 in the view is incremental and represents the total number of lazy writes from the last server restart. To find the number of Lazy Writes in a second, find the difference in the Lazy Writes counter values in two specific moments and divide by the time
DECLARE @LazyWrites1 bigint;
SELECT @LazyWrites1 = cntr_value
  FROM sys.dm_os_performance_counters
  WHERE counter_name = 'Lazy writes/sec';


WAITFOR DELAY '00:00:10';


SELECT(cntr_value - @LazyWrites1) / 10 AS 'LazyWrites/sec'
  FROM sys.dm_os_performance_counters
  WHERE counter_name = 'Lazy writes/sec';
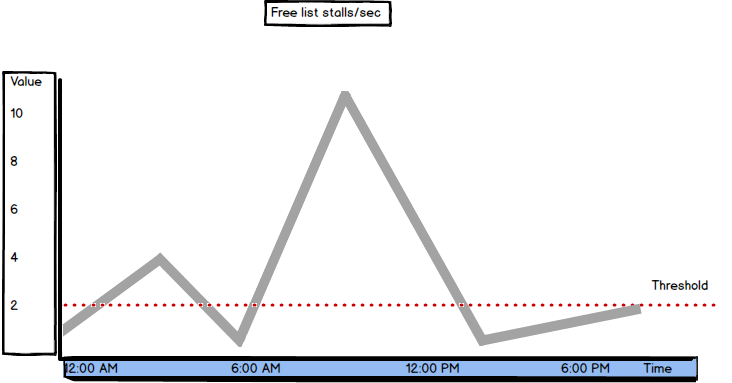
Free List Stalls/sec
Free list stalls/sec is another SQL Server metric available in Buffer Manager
"Indicates the number of requests per second that had to wait for a free page."[2]
If there were no free pages in the buffer cache, a request is stalled and has to wait until a page in the buffer is freed.
The recommended value is below 2. When the Free list stalls/sec value is higher than the recommended, check the Page Life Expectancy and Lazy Writes/sec values, as well. If the Page Life Expectancy value is below 300 seconds and Lazy Writes/sec above 2, it’s a clear sign of memory pressure.
As the Free list stalls/sec counter type is 272696576, the current value has to be calculated using the same method as for Lazy Writes.
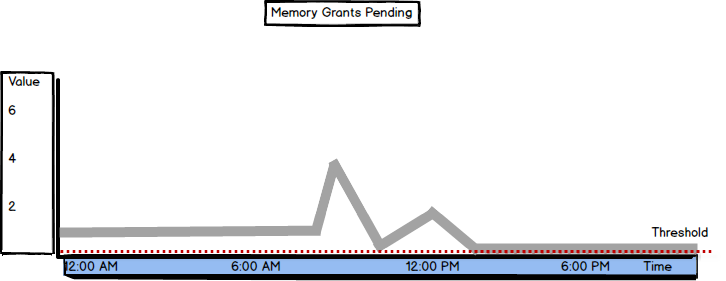
Memory Grants Pending
Memory Grants Pending is the metric available in SQL Server Memory Manager. Its value shows the total number of SQL Server processes that are waiting to be granted workspace in the memory.
The recommended Memory Grants Pending value is zero, meaning no processes are waiting for the memory, as there’s enough memory so the processes are not queued. If the value is constantly above 0, try with increasing the Maximum Server Memory value.
The value for this metric can be queried from the sys.dm_os_performance_counters view. No additional calculation is needed, as the cntr_type value 65792 shows the current value:
SELECT object_name, counter_name, cntr_value
FROM sys.dm_os_performance_counters
WHERE [object_name] LIKE '%Memory Manager%'
AND [counter_name] = 'Memory Grants Pending'
For troubleshooting the insufficient memory issues when the processes are waiting for memory to be granted, it is useful to know what processes and queries are waiting.
The sys.dm_exec_query_memory_grants view "Returns information about the queries that have acquired a memory grant or that still require a memory grant to execute. Queries that do not have to wait on a memory grant will not appear in this view." The grant_time value is NULL if the memory hasn’t been granted memory yet:
SELECT *
FROM sys.dm_exec_query_memory_grants
WHERE grant_time IS NULL
As high Memory Grants Pending values can be caused by inefficient queries, bad or missing indexing, sorts or hashes, query tuning and workload optimization are the first steps in resolving this issue. The last resource is adding more physical memory.
If the memory granted is insufficient for a query, which is especially the case with expensive operations that use a lot of resources, such as hashes and sorts, a hash or sort warning will be logged into a SQL trace
"A hash warning occurs when the hash build doesn’t fit in memory and must be spilled to disk (its actually written to tempdb). A sort warning occurs when a multi-pass sort is required because the granted memory was insufficient."
If a query spends too much time waiting for the memory to be granted, it will time out. If many queries wait for the memory grants, it’s likely that they will cause a block before they time out. Other SQL Server Memory Manager metrics that indicate memory usage by queries are:
- Memory Grants Outstanding – shows the number of granted memory requests
- Granted Workspace Memory (KB) – shows how much of query memory is currently in use
- Maximum Workspace Memory (KB) — shows the memory that SQL Server has designated as query memory
So far, we have presented the most important and commonly used SQL Server memory metrics. They provide three different types of information they provide. The first type is straightforward where the value clearly indicates bad or good performance, like Memory Grants Pending. The second is where checking the other metrics values is highly recommended because the bad value of the metric itself doesn’t have to be an indication of bad performance.
This is the case with Buffer Cache Hit Ratio. The third group of metrics are the ones that have no specific values for good and bad performance, but you should monitor them for a while and establish a baseline that you will consider as normal operation.
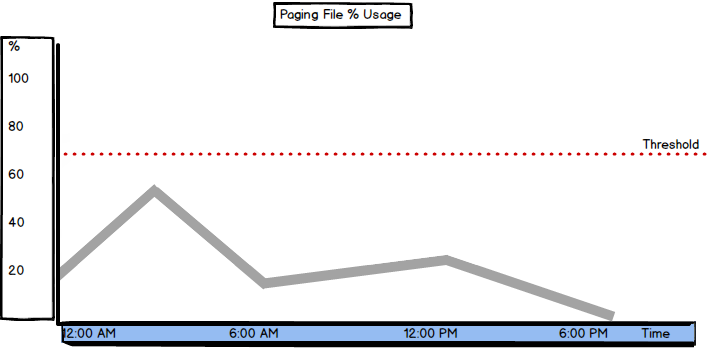
Paging File % Usage
Paging File % Usage indicates the amount of the paging file used by the operating system.
Paging is a process that occurs on systems with insufficient. To provide enough memory for the running processes, it temporarily stores some of the memory pages into the paging file on disk. Next time a process needs this page, it will not be read from RAM, but from the page file on disk.
When there’s no memory pressure on the system, every process has enough memory, pages are written into memory and flushed after the process is completed, freeing up the page for the forthcoming process.
A hard page fault is when the page is not in memory, but has to be loaded from a paging file on disk. This affects performance, as writing and reading a page from disk is several times slower than writing and reading from memory.
A soft page fault is when a page is still in memory, but on another address, or is being used by another program. Soft page faults don’t affect performance.
A useful information related to the paging file usage is the size of the operating system paging file and how much paging file space is available. You can obtain this information from the dm_os_sys_memory view:
SELECT total_page_file_kb, available_page_file_kb,
system_memory_state_desc
FROM sys.dm_os_sys_memory
Frequent paging and using a large percentage of the paging file requires reducing system workload or adding more memory.
The threshold you should not reach depends on the size of the paging file, but shouldn’t be more than 70%. As a rule of thumb, you can set the paging file to be 50% of total RAM:
“100 percent usage of a page file does not indicate a performance problem as long as the system commit limit is not reached by the system commit charge, and if a significant amount of memory is not waiting to be written to a page file.”
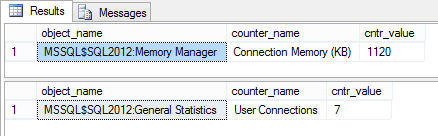
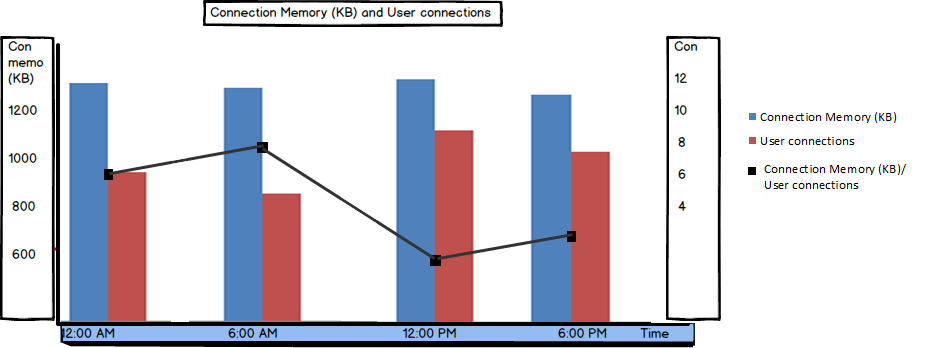
Connection Memory (KB)
The Connection Memory (KB) metric “specifies the total amount of dynamic memory the server is using for maintaining connections”.
This is the amount of memory used for storing connection context as well as network send and receive buffers
As this is one of the Memory Manager counters, you can obtain its value using a query such as
SELECT object_name, counter_name, cntr_value
FROM sys.dm_os_performance_counters
WHERE [counter_name] = 'Connection Memory (KB)'
This is where another metric comes in useful – User connections which shows the number of users currently connected to SQL Server:
SELECT object_name, counter_name, cntr_value
FROM sys.dm_os_performance_counters
WHERE [counter_name] = 'User Connections'
If the number of user connections is much higher than expected, the memory used per connection varies significantly, or these values are constantly increasing, the situation should be investigated and excessive connections killed.
Besides being a performance issue, this can be an indication of a security problem.
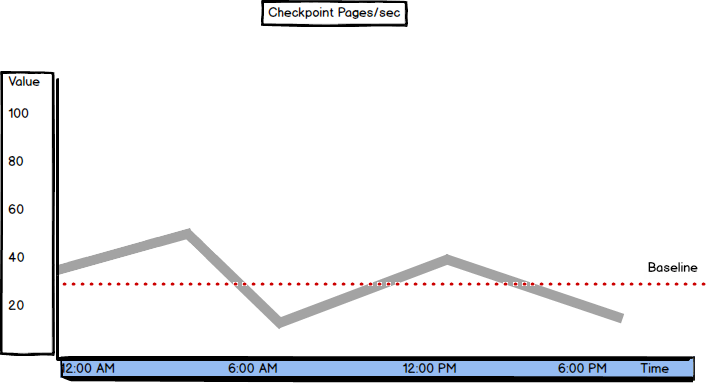
Checkpoint Pages/sec
Checkpoint Pages/sec shows the number of pages that are moved from buffer to disk per second during a checkpoint process.
SQL Server tries to provide enough available space in the buffer in order to provide good performance. To free up the space in the buffer, the modified (dirty) pages are periodically moved (flushed) from the buffer to disk, and the page in the buffer is set for overwriting. This process occurs at checkpoints.
This number of pages moved at a checkpoint is relative and depends on the hardware configuration and server usage. It’s recommended to create a baseline for this metric and compare the current values to it.
If more pages are flushed at each checkpoint, it might indicate an I/O problem. This is where besides automatic checkpoints, indirect checkpoints should be used, as they can be issued automatically to reduce the time between 2 automatic checkpoints and reduce the number of flushed dirty pages per second.
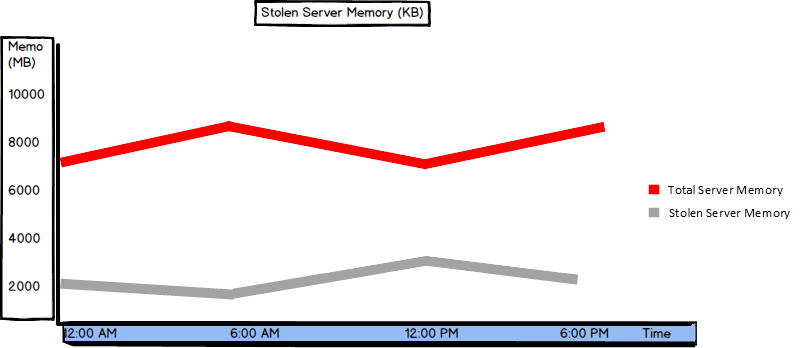
Stolen Server Memory (KB)
Stolen Server Memory (KB) shows the amount of memory used by SQL Server, but not for database pages. It is used for sorting or hashing operations, or “as a generic memory store for allocations to store internal data structures such as locks, transaction context, and connection information”.
The Stolen Server Memory (KB) counter was introduced in SQL Server 2012. In earlier versions, there was the Stolen pages counter:
SELECT object_name, counter_name, cntr_value
FROM sys.dm_os_performance_counters
WHERE [counter_name] = 'Stolen Server Memory (KB)'
There’s no specific threshold value, so it’s recommended to monitor this counter for a while and set a baseline. Note that the value should be close to the Batch Requests/sec value and low compared to the Total Server Memory counter. A high amount of stolen memory indicates memory pressure.
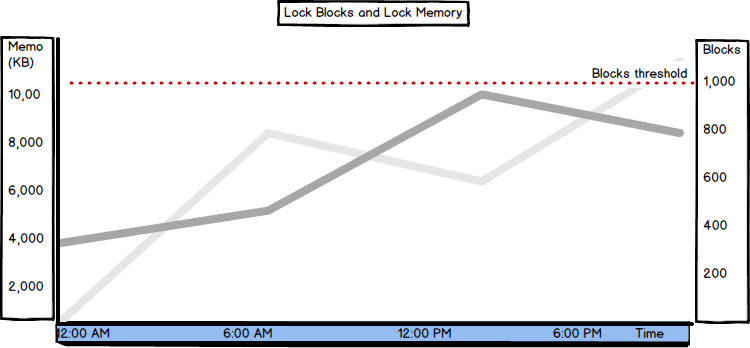
Lock Blocks, Lock Blocks Allocated, Lock Memory (KB), and Lock Owner Blocks
A lock block is a locked source, such as a table, page, or row.
Locking is a normal process on SQL Server. When a process uses a resource (e.g. page), the resource is locked. If another process tries to use the same resource, it will have to wait until the resource is released, which affects performance.
Locks occur when a process holds a resource longer than it should before releasing it, e.g. due to inefficient queries, or an error occurs so that the resource is not released automatically.
Lock Blocks shows the number of lock blocks in use on the server (refreshed periodically). A lock block represents an individual locked resource, such as a table, page, or row.
Lock Blocks Allocated shows the number of lock blocks allocated to support locks. The more locks occur, the more will be allocated. Lock Memory (KB) shows the total amount of memory the server is using for locks.
Lock Owner Blocks shows the number of lock owner blocks currently in use on the server. A lock owner block is a thread that is the owner of a lock;
SELECT object_name, counter_name, cntr_value
FROM sys.dm_os_performance_counters
WHERE [counter_name] in ('Lock Blocks', 'Lock Blocks Allocated', 'Lock Memory (KB)', 'Lock Owner Blocks')
When SQL Server is set to use dynamic lock allocation, 2500 lock blocks and 5000 lock owner blocks will be initially allocated per node.
The number of Lock Blocks should be lower than less than 1,000. If the value is higher, query tuning and optimization are the first steps to solve this issue. The Lock Memory (KB) value should be lower than 24% of the available memory.
Besides these, the following metrics can help with SQL Server memory performance indication, but are of no great significance: Free Memory (KB), Optimizer Memory (KB), Reserved Server Memory (KB), SQL Cache Memory (KB), Page lookups/sec, and Readahead pages/sec.
 |  |
Do you make a baseline for performance on your SQL Server production environment? If yes, do you monitor the most useful counters?
Check what are the most correct counters to monitor to check your SQL Server memory needs and issues on HeelpBook:
SQL Server memory performance metrics and bottlenecks – http://heelpbook.altervista.org/2015/sql-server-memory-performance-metrics-and-bottlenecks/ #howto #sql #heelpbook #microsoft #database @heelpbook